JMeter for Load Testing – A Complete Guide For Beginners
If you are into manual testing and planning to learn a testing tool, though just to add in your resume, definitely consider JMeter For Load Testing.
This is because Jmeter doesn’t require coding knowledge, comparatively simple, widely recognized, and in demand for performance and load testing.
And now if you have decided to learn Jmeter for load testing and performance testing, here is a complete guide for you to start with:
Jmeter For Load Testing:
- what is JMeter
- Advantages Of JMeter
- Installation Of JMeter
- How To Use JMeter
- JMeter With Example
- Best Practices For JMeter
1. What is JMeter
If you have to test the web application, you may want to know how many concurrent users can a web handle. Then, you will have to try with 100, 1000 users and it’s not feasible to arrange 1000 people to test your web.
Hence you can use Jmeter to do that. JMeter is an Apache open-source, it’s pure Java and can be used for load test and measure performance.
2. Advantages of JMeter:
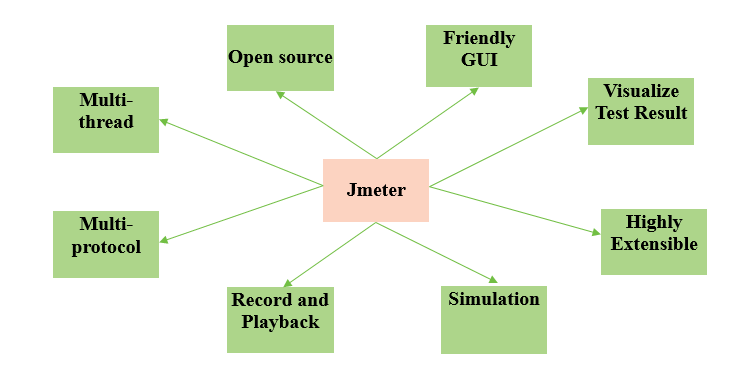
There are many advantages of JMeter, we will focus on 8 main points as below:
2.1. Multi-thread: allow multiple separated thread group to do various functions in parallel
2.2 Open source: it’s an open-source testing tool, free for downloading and free for developers to use the source code for the development.
2.3. Friendly GUI: it is a friendly graphic user interface, very easy to use and get familiar with it.
2.4. Visualize Test Result: Jmeter provides test results in different formats: table, chart, tree
2.5. Highly Extensible: you can extend your test, Jmeter allows you to use visualization plugins
2.6. Simulation: simulate multiple users, create a heavy load on a server or object to test
2.7. Record and playback: you can record your activities on the browser and replicates them
2.8. Multi-protocol: Jmeter supports multi-protocols such as HTTP, FTP, JDBC, LDAP, JMS, SOAP
3. Easy steps to install Apache JMeter
Jmeter is compatible with Linux, Windows, Mac OS, Ubuntu. Let move ahead to set up Jmeter on Ubuntu.
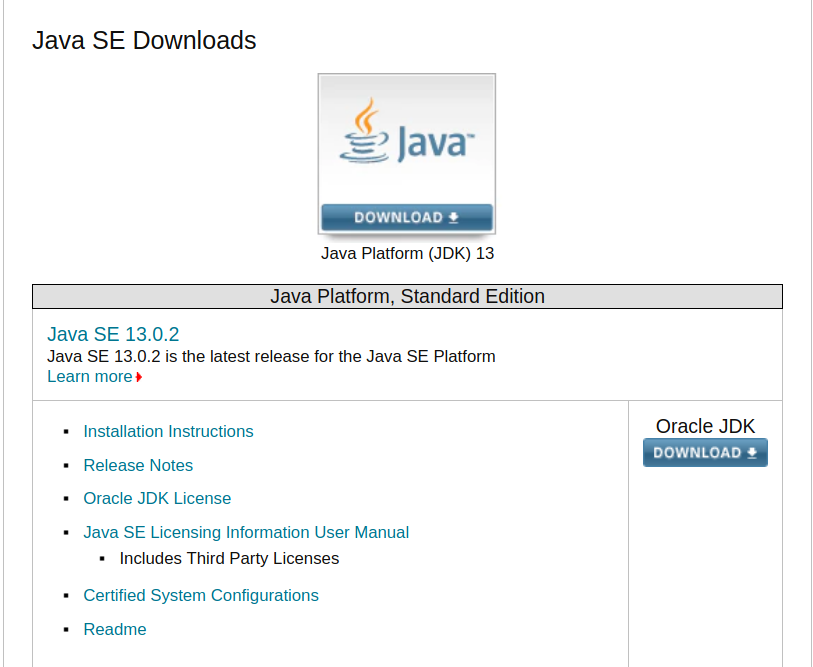
3.1. Install latest Java
3.1.1 Download the latest Java platform: https://www.oracle.com/technetwork/java/javase/downloads/index.html
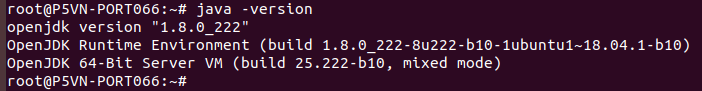
3.1.2. Make sure java is installed successfully:
3.2. Installing Apache JMeter.
3.2.1. Download latest JMeter binary
Go to the official Jmeter website to get the latest tgz file(Now the latest version is apache-jmeter-5.2.1.tgz): http://jmeter.apache.org/download_jmeter.cgi
3.2.2. Use below command to extract the downloaded file:

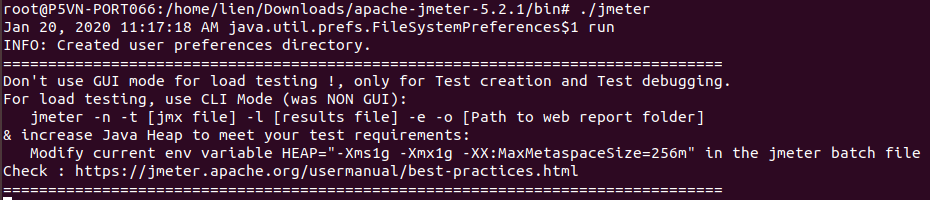
3.2.3. Access to the extracted directory and install Jmeter

4. How to use JMeter for Load Testing / Performance Testing:

4.1. Add thread group
Threads mean users, we use one thread to simulate one concurrent user
4.1.1. Start Jmeter from /bin folder:
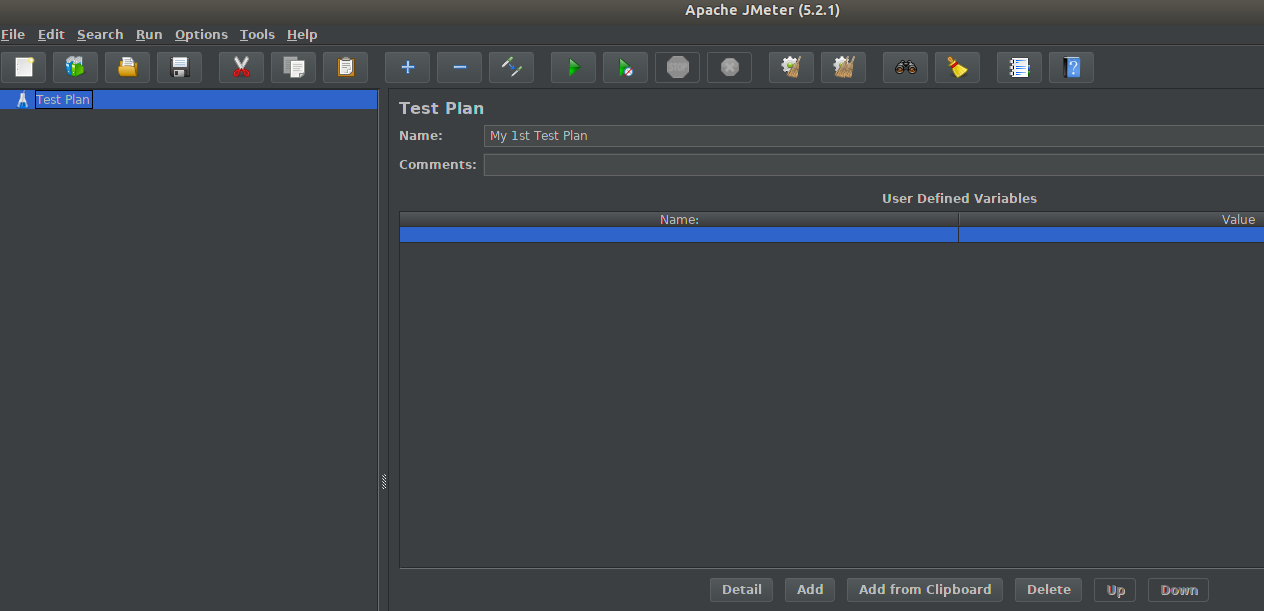
4.1.2. Create a new Test Plan with the name “My 1st Test Plan”
4.1.3. Add thread group
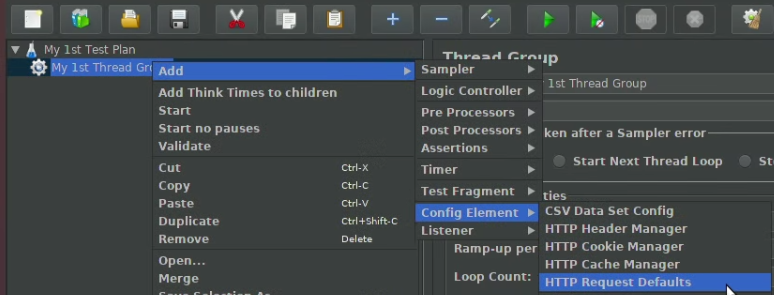
From Jmeter > Test Plan, right-click and add a new thread group: Add – Threads – Thread Group
Let see some statistics:
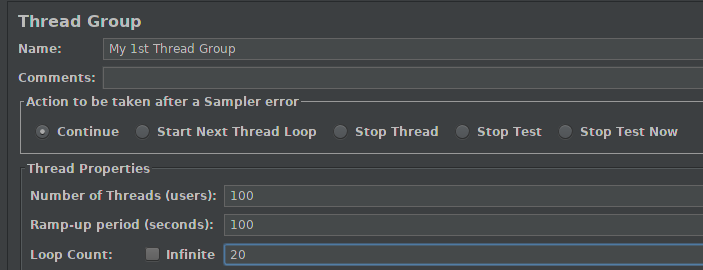
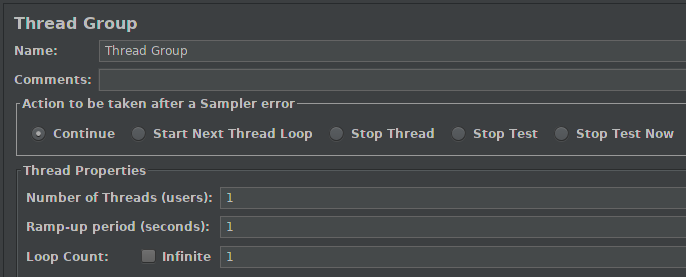
- Name: the thread name, in this example it is “My 1sr Thread Group”
- Number of Threads (users): number of concurrent users, if you want to know the performance of your web application with 100 concurrent users, set it to 100
- Ramp-up period (seconds): number of time for each user to hit the server, it shows how many time delay before stating the next user, in this example we set it to 100, it means the delay is 1 second
- Loop Count: it shows how many times one user connect to the server, in this example we set it to 20, it means one user will connect to the target server 20 times
4.2. Add JMeter elements
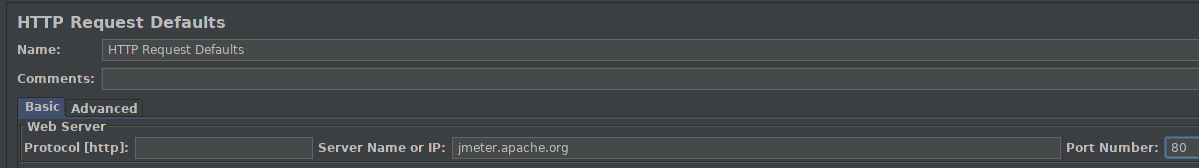
4.2.1. Create an HTTP request default
Why do we have to create it first?
Concurrent users (threads) will access the target server, so we need to define which is the target server, which port?
Let set the value for “Server Name or IP” to “jmeter.apache.org”, port number: 80
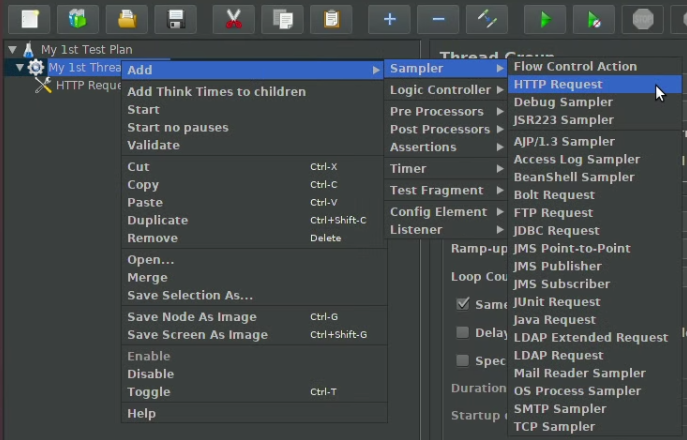
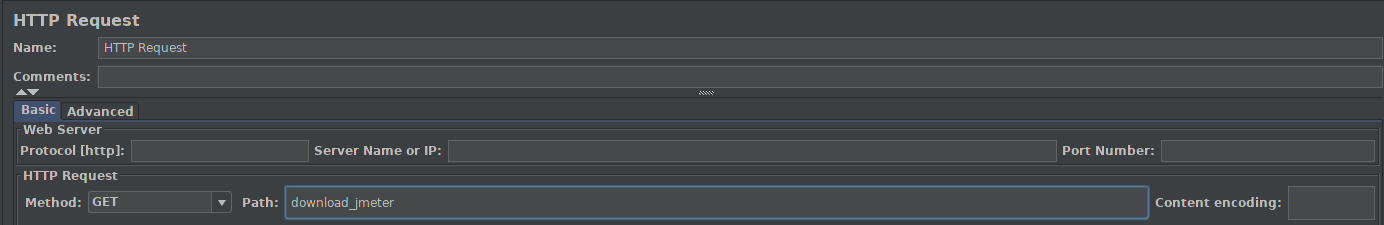
4.2.2. Create a HTTP Request
Let see the value for Path, if we let it blank, Jmeter will create a request directly to the server name above: “jmeter.apache.org”, in this example, we want to make requests to download page.
4.3. Add Graph Result
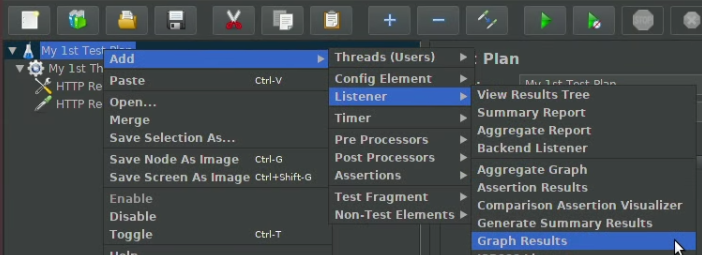
You can select to generate a summary result or results tree, in this example we will show graph results
Final step: save the test plan and run it.
Here are the results:
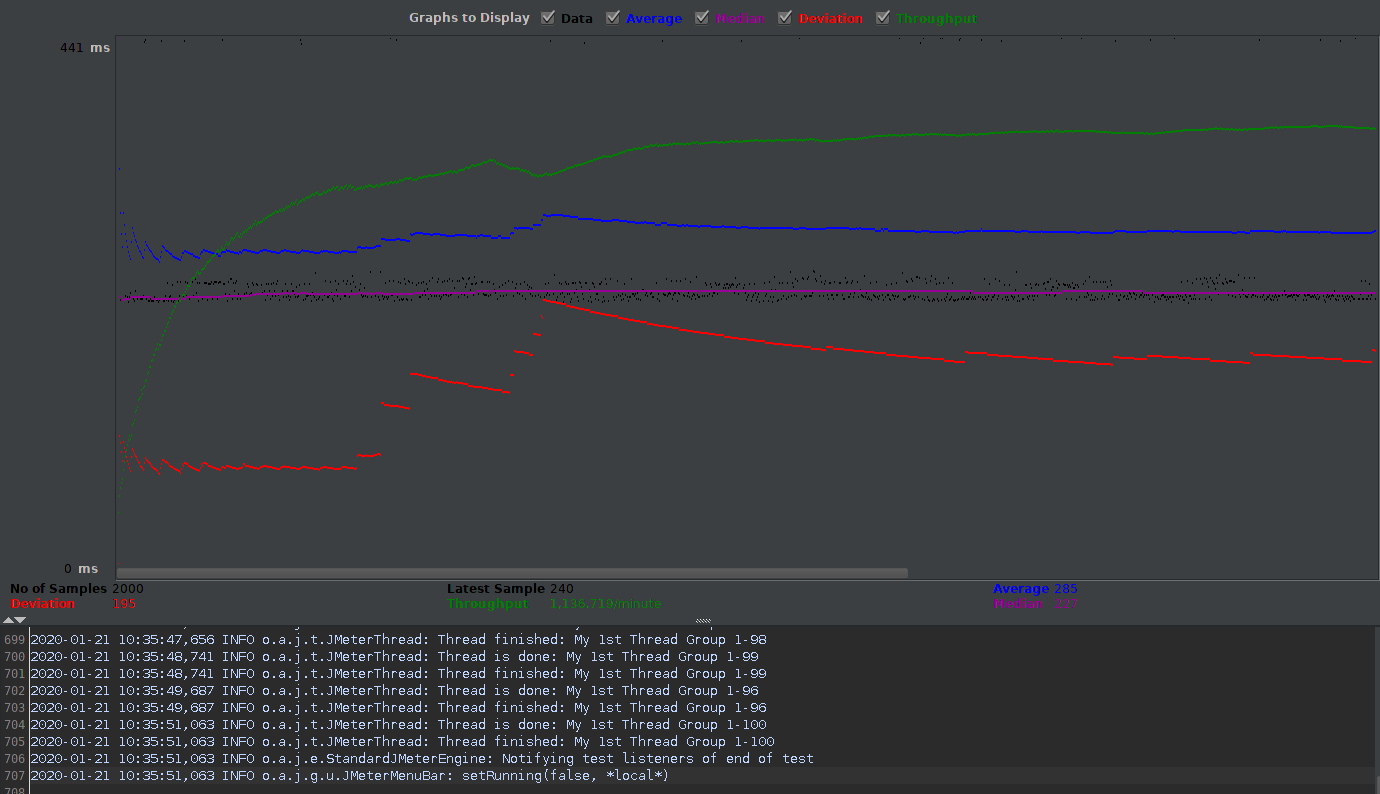
- No of Samples: total users we used for this test (100*20=2000)
- Latest Sample: the sample time in ms. It is the response time for the last requested URL. In this case, it is 240 ms, which means the response time for the last request sample is 240 ms.
- Throughput (important metric): the number of requests per unit of time (second, minute,..) (higher value is better).
Throughput shows the ability of the server to handle a heavy load. In this case, “jmeter.apache.org”
can handle 1136,719 requests per minute, this is quite high so let say this server has high
performance
- Average: the average response time for total users
- Median: midpoint of a frequency distribution, in this case, it is 227 for 2000 users
- Deviation: the distance of the values to their average (smaller value is better).
5. How to record an example script
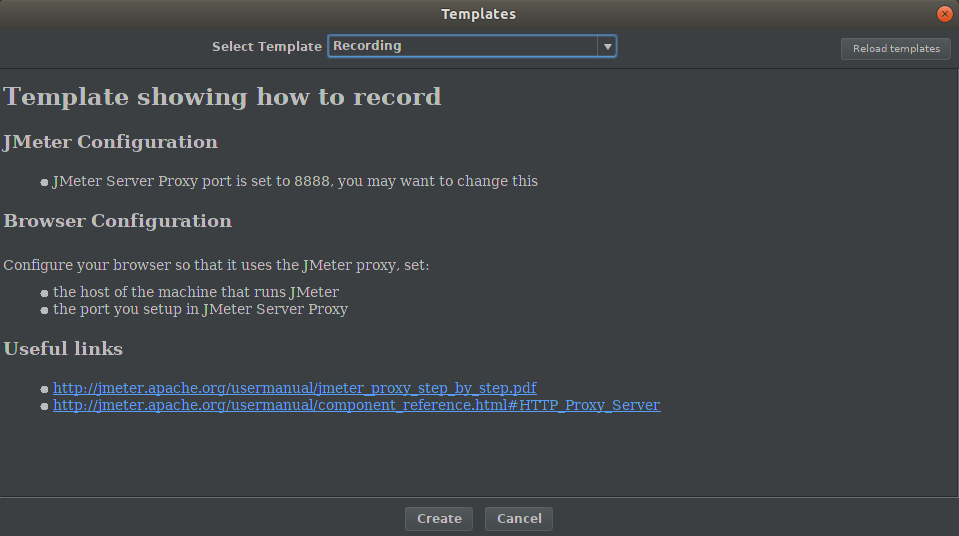
5.1. Select Recording template
5.1.1. Open Jmeter > Templates > Recording
5.1.2. Keep HTTP Request Defaults element setup in 4.2.1 step
5.1.3. Setup for Thread as below
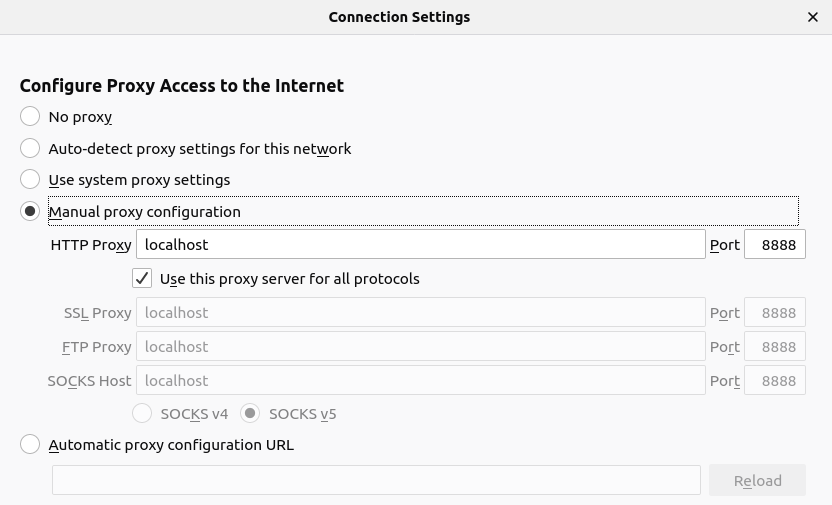
5.1.4. Configure your browser network
5.1.5. Validate the script
Right-click on Thread Group> Validate
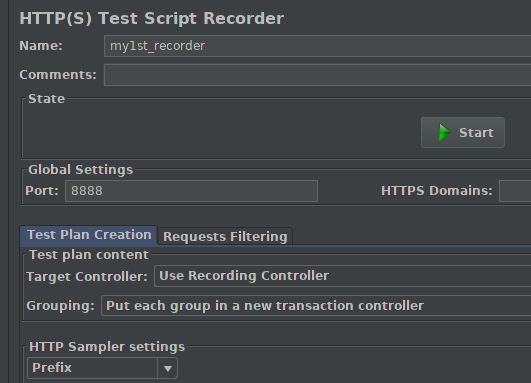
5.1.6. Go to test script screen and press “Start” button
5.1.7. Access to https://jmeter.apache.org and click on some context
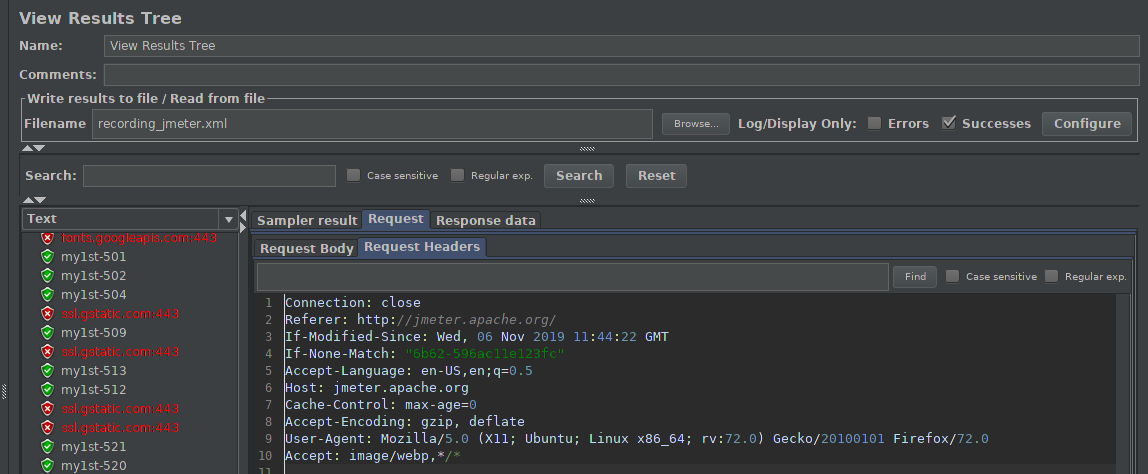
5.1.8. View results
6. Best practices for your Jmeter Tests
- Use a proxy server to record your testing: it’s a useful feature to record your test in your browser
- Check Jmeter log: errors in the test plan will be found easily in the log
- Decrease Resource requirement: in case of simulating multiple users (more than 100 users), View Result Tree and JMeter graphs results will consume more memory, this should be deactivated, instead, we can use CSV test result format
- Limit the number of Threads: be aware of the maximum number of threads in Jmeter is 300
7. Conclusion
Jmeter is easy for load testing on the web. Jmeter results are useful for improving the performance of a web. It’s free and you can use it to automatize your work.
RPT for Performance Testing of Web Application is another easy to use a tool by IBM. Here is a step by step guide with screenshots, on how to use RPT.
Hope this article will help you to write your first test with Jmeter. Let me know if you have any questions or suggestions